Posts

Showing posts from March, 2019

Lab 12 [GIS5050L]: Georeferencing, Editing, & 3D
Image
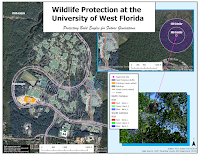
Created using ArcGIS Pro 2.2.0 This week's lab covered three key skills in ArcGIS: georeferencing, editing, and overlaying data in a 3D environment. First, we learned the process to select control points for image registration, referred to as georeferencing. For the map shown on the left, this involved selecting points in the raster image and linking them to their corresponding point in a loaded vector feature class (e.g., corner of a building). Several transformations were possible based on the number of control points selected, target root mean square error (RMSE) values, and the desired appearance of the final registration (e.g., choosing a 1st or 2nd order polynomial transformation based on which one minimized RMSE or distortion).  This week's lab also emphasized editing of feature classes in the form of adding polygons and lines to existing building and road feature classes, respectively. The process of digitizing these features was based on using the outline of t

Lab 11 [GIS5050L]: Geocoding & Network Analyst

Image
Created using ArcGIS Pro 2.2.0 This week's lab focused on best practices when geocoding data, including following the four-step process of reviewing your table of locations for the best fields to use, choosing the best locator, mapping the fields in the most efficient ways, and correctly naming your output file for the results.  Additional training emphasized how to resolve unmatched items using a combination of choosing a good basemap with street imagery, cross-searching in Google Maps, and using Select by Attributes in ArcGIS to narrow down possible matches. These skills were used in the map above to correctly place emergency management service (EMS) stations that were initially unmatched. The lab concluded with an introduction to the Network Analyst in ArcGIS to determine the best routes between several stops on this map. This is shown above for three of the EMS stations. This part of the training emphasized different ways to adjust the cost of a particular route, using

Lab 10 [GIS5050L]: Vector Analysis, Part 2

Image
Created using ArcGIS Pro 2.2.0 This weeks lab provided an introduction to buffer analysis and overlay tools. The map above was generated based on locating intersections of great campsite locations within a specific distance of water sources and roads that were also outside of known conservation areas in De Soto National Forest in Mississippi. The lab did a great job of summarizing the relevance of variable distance buffers. In this context, the map above looked at areas within 150 meters of lakes and 500 meters of rivers. The lab also addressed how to use ArcPy to quickly perform new buffer analyses (instead of using the slower toolbox settings approach). Finally, the lab summarized the advantages of a singlepart layer compared to a multipart layer as an alternative means to more effectively explore the properties of each location in the map further.

Lab 9 [GIS5050L]: Vector Analysis, Part 1

Image
Created using ArcGIS 2.2.0 The maps above provide examples of conducting location queries in ArcGIS.  The map on the left is an example of land parcels within the City of Pensacola that are within 4000 ft of the coastline and regional rivers/water sources. On the right, I refined the query to extract from the set on the left only those land parcels that were also within 100 ft of major roads.  The training this week noted the importance of planning prior to conducting the queries to make the spatial analysis run smoothly. For example, this meant thinking about the order of the queries and whether one should return to the original data set or cascade the next processing step from the subset produced by a previous query result. I also learned  how to recognize where query results  a ppear within the navigation screens of ArcGIS and within any associated geodatabase assigned for storage.  Finally, the training this week further and clearly emphasized the relevance of each o

Labs 7-8 [GIS5050L]: Midterm Data Search

Image
  Created using ArcGIS Pro 2.2 This week's lab involved independently locating nine different sources of data sets to compose three maps highlighting various features within Brevard County, Florida. Goals of this lab included seamlessly using vector data in the form of points (e.g., cities, locations of invasive plants), lines (roads), and polygons (e.g., lake boundaries), alongside raster data (e.g., for elevations, land use, and aerial photography).  Additional skill reinforcement focused on determining a common coordinate system to project all the data, clipping each layer of data to the county boundary, and then using map frames in informative ways to create the final set of layouts. The most interesting part of the lab for me was determining how to create a theme for each map. The most challenging aspect was adjusting labeling properties within layers to reduce clutter.