Posts

Showing posts from November, 2019

Lab 5 [GIS5027L]: Unsupervised and Supervised Classification
Image
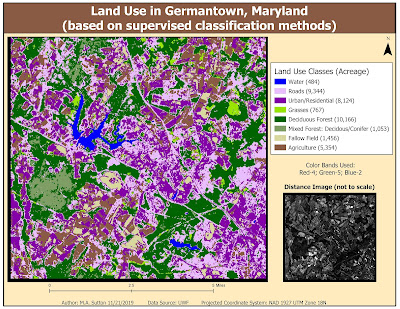
This week's lab focused on using the tools within ERDAS Imagine to perform unsupervised and supervised classification of pixels representing various features in an image. In the map above, supervised (maximum likelihood) classification was used to classify pixels based on eight different classes of land use. The results above demonstrate many urban/residential areas were misclassified within the roads class. The results can be improved by selecting more signature samples for these two classes and then also evaluating these signatures to determine the optimal 3 bands that help with differentiation prior to running the classification algorithm. Two helpful tools in ERDAS Imagine for signature evaluation include examining histogram plots and mean plots of the image bands of the features you are seeking to differentiate.
Lab 4 [GIS5027L]: Spatial Enhancement, Multispectral Data, and Band Indices

Image
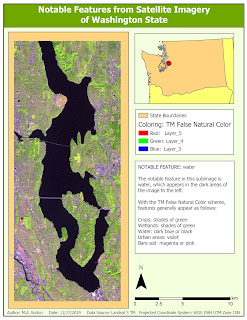
Map 1 Map 2 Map 3 The subimages above were derived from imagery from the Landsat 5 satellite. To locate the features most prominent in each of the noted areas, analysis of the histograms of the various bands was performed to locate specific peaks. Following this, each subimage was colored using a color band combination that most effectively highlighted the discovered feature with the specific histogram characteristics.  Map 1 was colored so that bodies of water would appear dark against contrasting land and urban areas. Map 2 was colored so that snow in mountainous areas would be distinghishable from surrounding areas of vegetation. Finally, Map 3 was colored to enhance shades of blue within waterways where sediment was present.

Lab 3 [GIS5027L]: Intro to ERDAS Imagine and Digital Data

Image
This week's lab introduced features within the ERDAS Imagine tool that can be utilized to understand and process satellite data. In the map above, the full-size Landsat Thematic Mapper image was loaded into ERDAS Imagine for preprocessing to crop a select region in Northwest Washington State. The attribute table within ERDAS Imagine was then supplemented with a field to determine area values for each of the land classifications in that area. After preprocessing, the image was then loaded into ArcGIS Pro to create the final layout. A focus of this week's skill development was cleaning up the formatting in the legend area to highlight only those classes relevant to the displayed image. In addition, we learned how to format the legend to include the area values that were imported into ArcGIS Pro from ERDAS Imagine.

Lab 2 [GIS5027L]: Land Use / Land Cover Classification and Accuracy Assessment

Image
This map demonstrates practice creating polygons representative of land use / land cover by examining the underlying features in the aerial photograph for details relevant to classify at Level II of the USGS Standard Land Use / Land Cover Classification System. This lab further demonstrated ways to utilize Google maps as  part of ground truthing a random set of 30 points drawn throughout the image to measure overall accuracy (shown in the map above at 70%).