 |
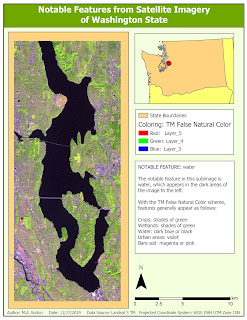
| Map 1 |
 |
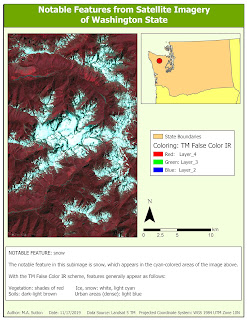
| Map 2 |
 |
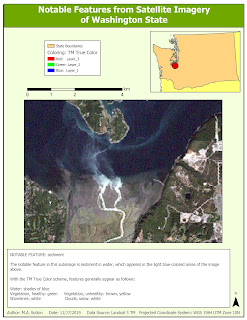
| Map 3 |
The subimages above were derived from imagery from the Landsat 5 satellite. To locate the features most prominent in each of the noted areas, analysis of the histograms of the various bands was performed to locate specific peaks. Following this, each subimage was colored using a color band combination that most effectively highlighted the discovered feature with the specific histogram characteristics.
Map 1 was colored so that bodies of water would appear dark against contrasting land and urban areas. Map 2 was colored so that snow in mountainous areas would be distinghishable from surrounding areas of vegetation. Finally, Map 3 was colored to enhance shades of blue within waterways where sediment was present.


Comments
Post a Comment