Lab 6 [GIS5050L]: Projections, Part 2
Created using ArcGIS Pro 2.2
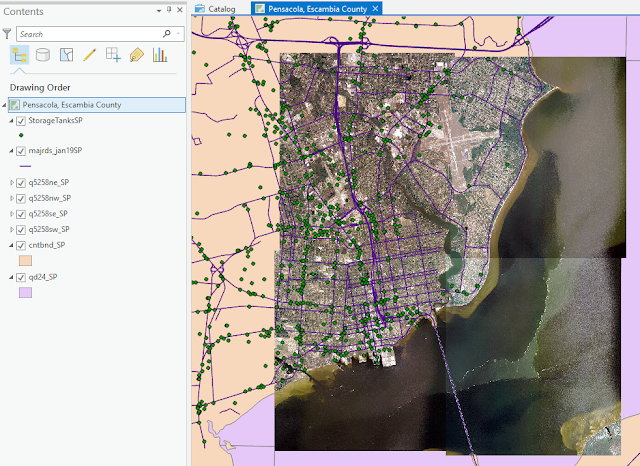
This week's lab focused on acquiring data from a variety of online sources to create an informative set of layers for one city in Escambia County, Florida. Pensacola was selected for this.
In the map above, the aerial imagery came from the Labins.org site. Overlaid on top of this are the major highways from the Florida Geographic Data Library (FGDL) site. The green symbols represent petroleum storage tank contamination locations imported from an Excel file provided by the Florida Department of Environmental Protection site.
Skills emphasized in this lab included loading tabular data created in Excel into ArcGIS. In the example above, this involved converting geographic coordinates in degrees/minutes/seconds to decimal degrees inside Excel prior to ArcGIS loading. Additional skills emphasized in the lab included understanding the projection system of each data set when it was created and then making sure all data sets were re-projected as needed to be in the same projected coordinate system (State Plane).


Comments
Post a Comment